
Make your .NET app capture its own memory dump
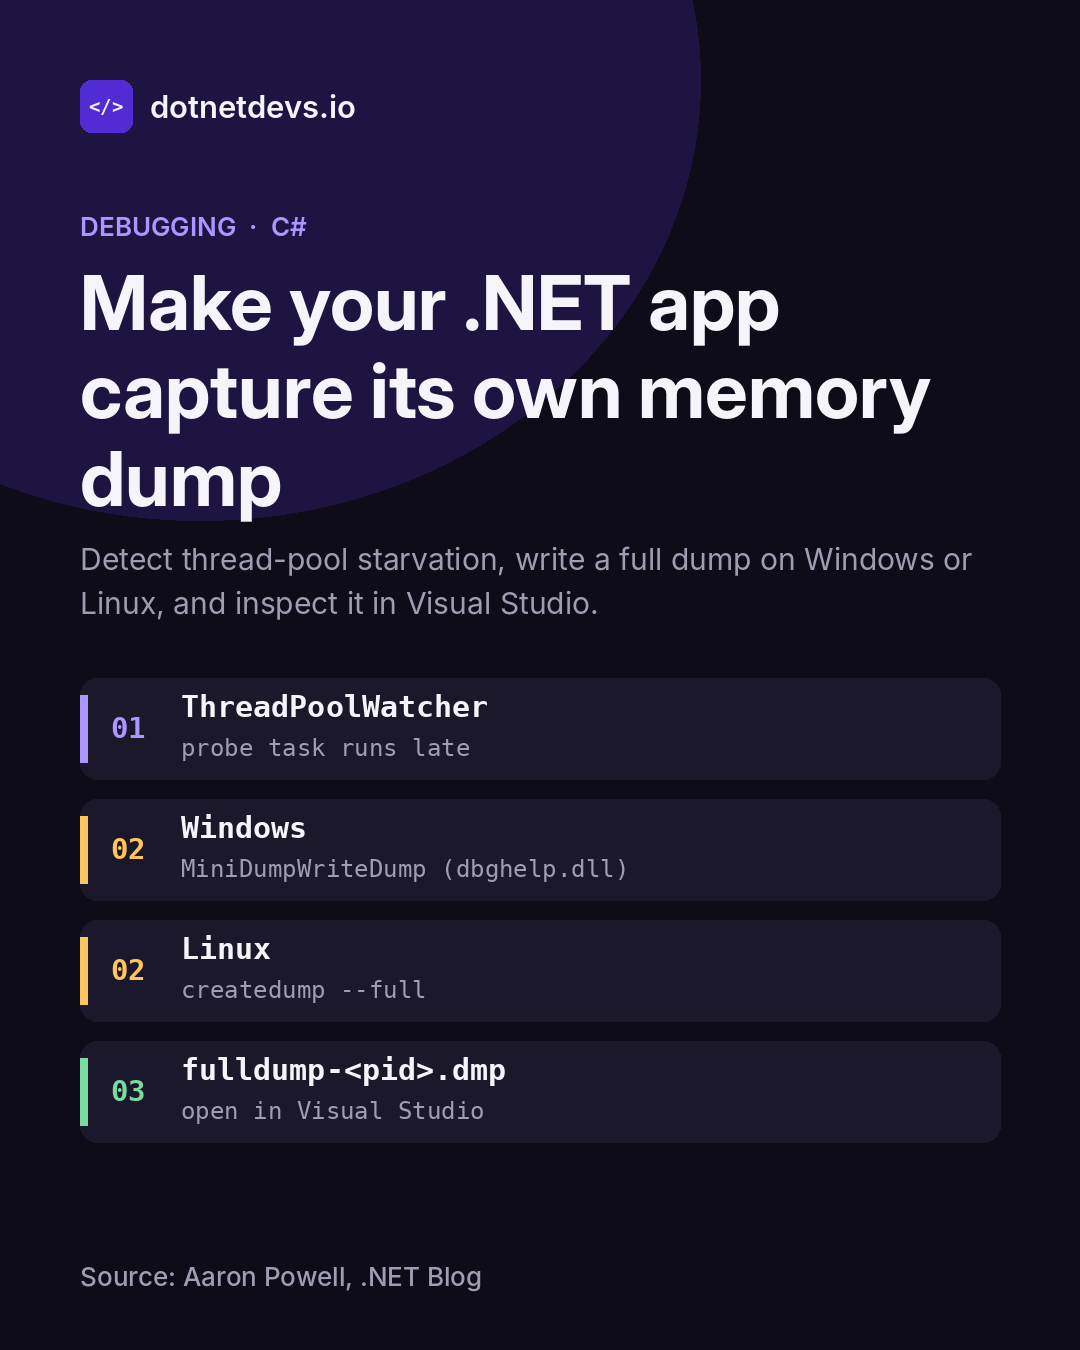
A background watcher queues a small probe task on the thread pool every few seconds. If the probe runs late, the pool is probably starved, so the app writes a full memory dump of itself: MiniDumpWriteDump from dbghelp.dll on Windows, the runtime's createdump tool on Linux. You can then open the dump in Visual Studio and look at call stacks and the Parallel Stacks view.
Worth knowing: Full dumps are large and can contain secrets such as tokens and connection strings, so the article recommends a restricted directory, a cooldown and a file limit. On Linux, container and ptrace permissions may need adjusting.